Goniophotometer RiGO801-LED
Ray Files of UV LEDs – New Goniophotometer Technology
Application Note – AN2004
This page provides a summary of Application Note AN2004 on the measurement of ray data from UV LEDs. It presents the results and analyses of two UV LED measurements at wavelengths of 265 nm and 365 nm.
Measurement of Ray Data
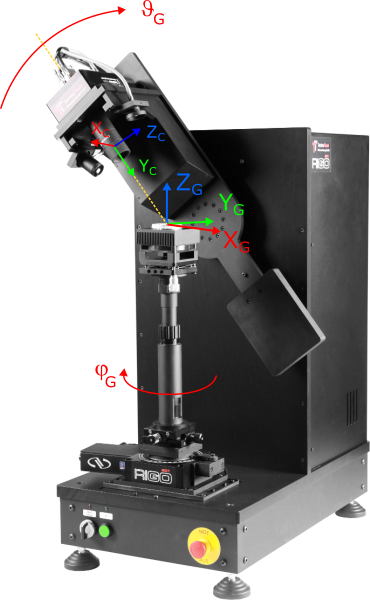
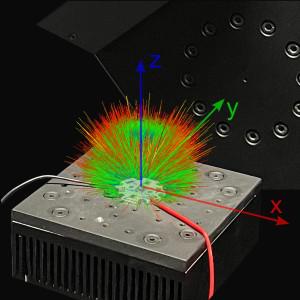
All RiGO801 goniophotometers use the near-field measurement principle, in which an LMK 6-5 luminance measuring camera moves around the light source to capture the spatial luminance distribution. This is subsequently converted into ray data and the luminous intensity distribution (LVK).
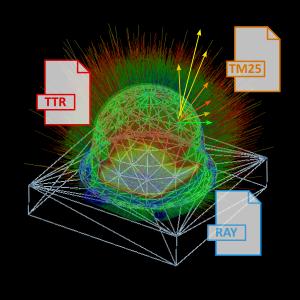
Ray data, also often referred to as ray files, consist of vectors with associated portions of luminous flux. A sufficiently high number of rays accurately represents the emission characteristics of a light source. They are frequently used for realistic simulation of optical components.
Ray Data Measurement of UV LEDs with a newly developed goniophotometer
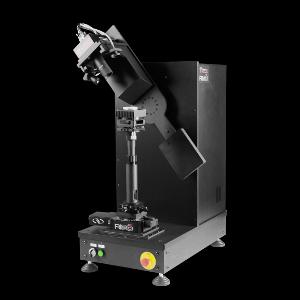
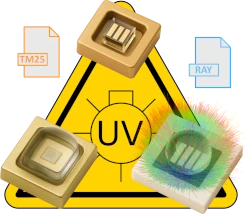
With the newly developed UV goniophotometer from TechnoTeam, it is now possible to reliably capture ray data of UV LEDs in the range from 200–400 nm. Thanks to a special image sensor and UV-capable optics with quartz glass lenses, measurements are possible in the UV-C, UV-B, and UV-A ranges.
The system enables the measurement of ray data for optical simulations – ideal for applications in medical technology, analytics, 3D printing, disinfection, and fluorescence technology. It is based on the proven RiGO801-LED goniophotometer, which is specifically designed for the measurement of ray data from LEDs and LED modules.
Example Measurements with the UV LED Goniophotometer
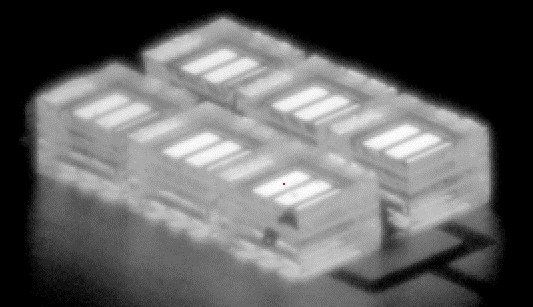
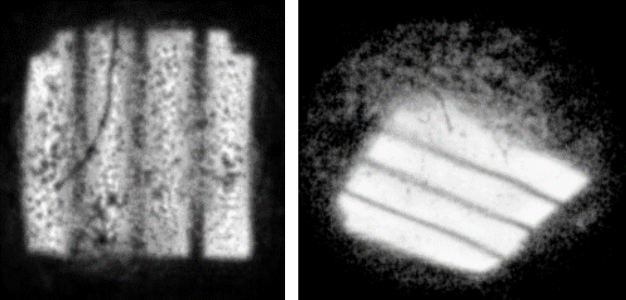
Camera image UV LED 1 (log. scaling, UV mode)
The new UV goniophotometer demonstrates impressive resolution and precision in capturing UV ray data. Measurement results are presented for two UV LEDs at 265 nm and 365 nm.
LED 1: UV-C – 275 nm
This LED consists of six individual chips, whose flip-chip design is clearly visible in the camera image (see adjacent image).
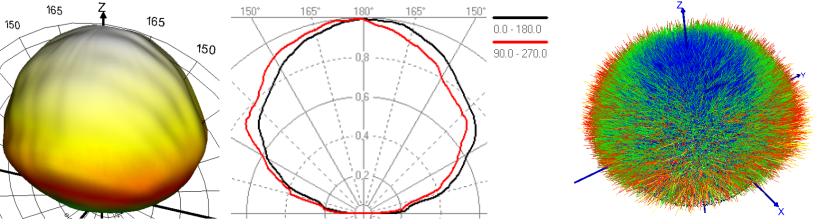
For further analysis, the ray data were exported into the IES TM-25 format using TechnoTeam’s free Converter801 tool (see AN2003). The following figure shows the relative radiant intensity distribution and a visualization of the ray data.
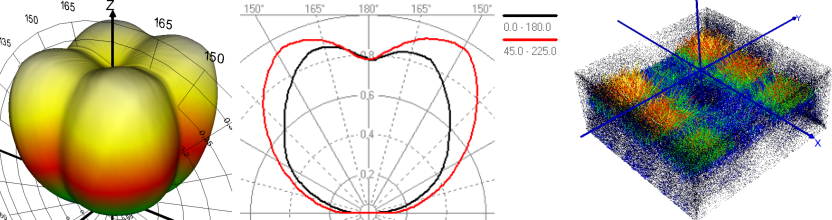
LED 1 – Relative radiant intensity distribution as 3D view and polar diagram, ray data
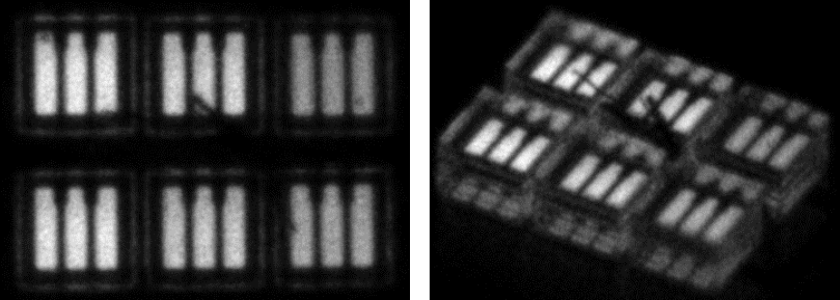
LED 1 – Example views from ray tracing
A ray tracing on the x/y plane and a perspective view demonstrate the high level of detail in the measured data. A notable feature: fine, line-like artifacts in the ray pattern turned out to be fibers. These were subsequently removed and are therefore no longer visible in the updated camera image shown above.
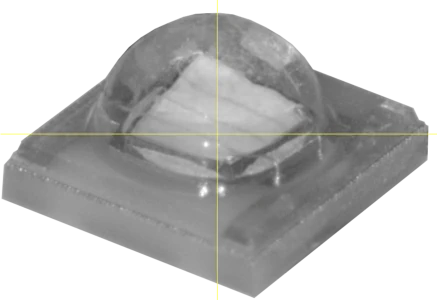
LED 2, Alignment in VIS mode
LED 2: UV-A – 365 nm
LED 2 is a UV-A LED with an integrated lens. The evaluation of the ray data was carried out analogously to LED 1. The ray tracing clearly shows the effects of lens imperfections – with high spatial resolution and fine detail.
LED 2 – Relative radiant intensity distribution as 3D view and polar diagram, ray data
LED 2- Example vews from ray tracing
Summary
The presented results highlight the great potential of the new goniophotometer for the precise measurement of UV LEDs in the UV-C to UV-A range. The quality of the ray data meets the high standards of the proven RiGO801-LED system.
Would you like to learn more or have ray data measured for your UV LEDs? Get in touch with us – we’ll be happy to assist you.