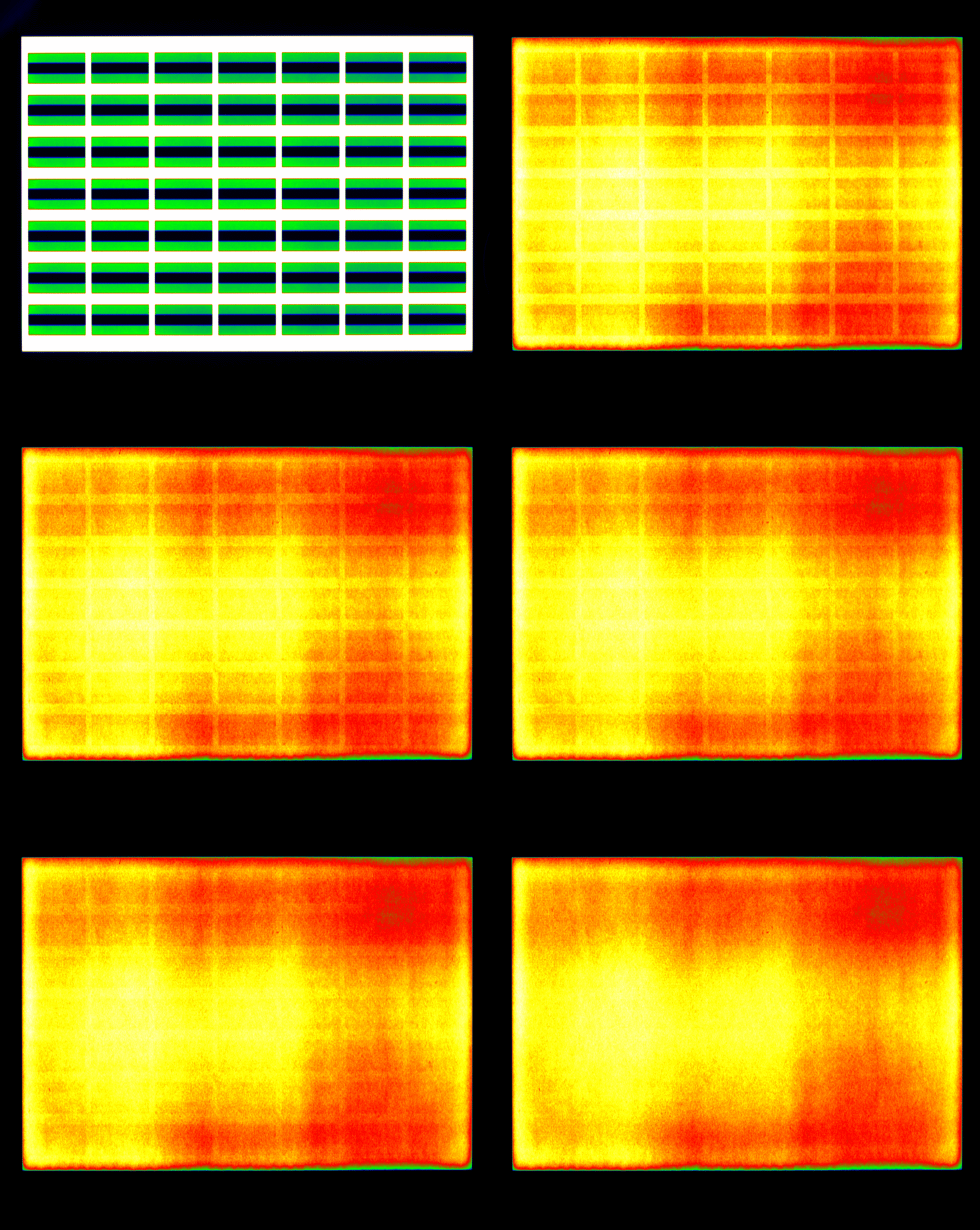
Luminance images of the evaluation period that show the vanishing image sticking phenomenon
Advanced image sticking measurements
Application Note – Advanced image sticking measurements
This page shows a summary of the application note. Topic of the document is the measurement of image sticking on displays and the most important aspects that have to be considered during a measurement. These concepts are general and thus independent on any specific evaluation method.
What is image sticking?
Static image content is typical for specific displays, for instance, in the public sector at airports and train stations (traveling information), on touch screens (app symbols), or even video gaming in consumer applications or smartphone applications. If the image is updated, a ghost image of the previously static content may remain temporarily or permanently visible. This phenomenon is called image sticking, residual image, latent image, image retention, or burn-in. This application note helps to understand important aspects of the image sticking measurements. It describes the options and advantages within the TechnoTeam evaluation procedures using either an LMK5 or LMK6 and the LabSoft.
Measurement of image sticking and its measurement aspects
An image sticking measurement, or rather a measurement series, consists of three steps:
- Warm-up period to recover the display from possible initial image sticking and to ensure a steady-state condition
- Burn-in period pattern is displayed to induce a worst-case scenario for image sticking (different patterns and grey levels are used depending on the method)
- Relaxation period to measure the time-resolved image sticking relaxation (different patterns and grey levels are used depending on the method)
Image sticking measurements can be very time-consuming and, depending on the display, cannot be repeated on the same sample, for example, with OLED displays, where the burn-in may cause permanent damage. In this context, three main aspects of an image sticking measurement should be considered before and during the measurement. These are the temporal alignment, the grey levels used, and the type of display non-uniformity correction.
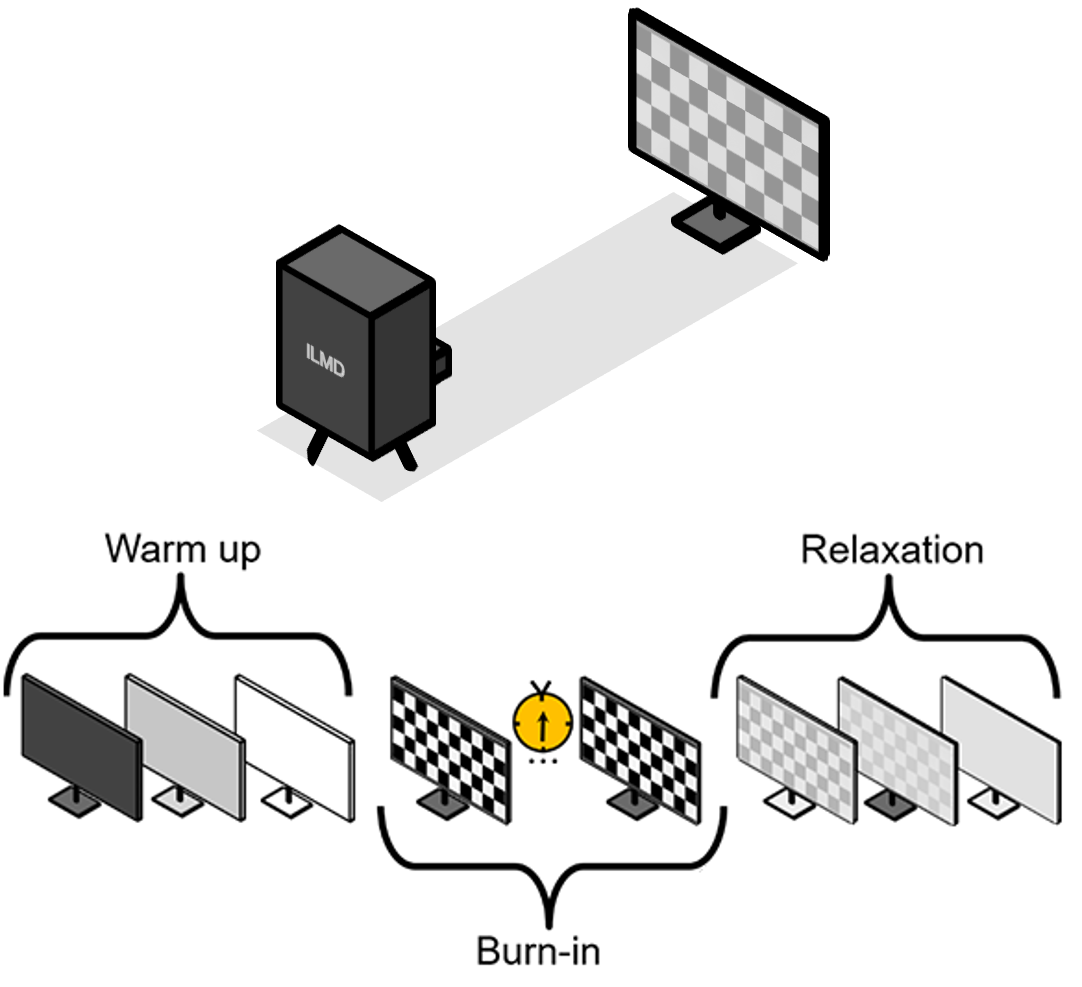
Top: General setup of an image sticking measurement using an Imaging Luminance Measurement Device (ILMD) as for instance the LMK6
Bottom: General schedule of an image sticking measurement series with exemplarily test patterns
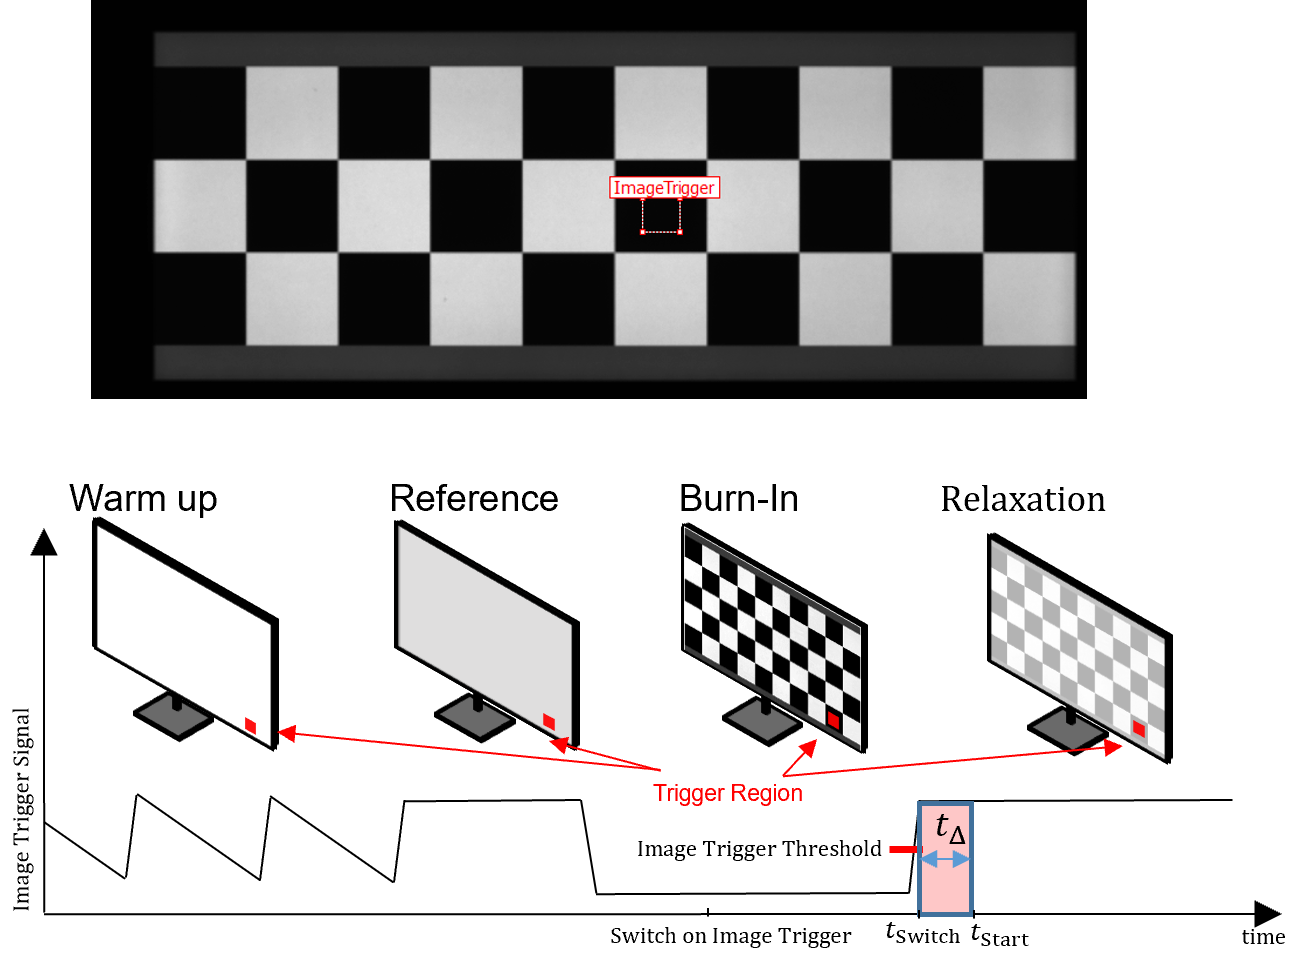
Top: User-Interface to select the trigger position
Bottom: Working principle of the trigger during an image sticking measurement
Impact of timing
The measurement start of the first relaxation image needs to be well-aligned with the pattern switching from the burn-in to the relaxation image to correctly assess the initial level of image sticking. If the measurement starts too late, the image sticking will already begin to vanish. If the measurement starts too early, and parts of the burn-in pattern are evaluated by accident, then the value will be too high. All this gets more complex in the context of setup and display-dependent input lags between sending the pattern switching signal and the actual pattern switching.
To overcome complex temporal alignment strategies, TechnoTeam developed an image content-based trigger for the LMK6. The camera will observe a freely adjustable part of the burn-in pattern with a very high frequency and optically detect the pattern switching.From this well-defined reference point, the measurement start can be set with any chosen delay, simply and reproducibly. The images on the right visualize the working principle of TechnoTeams image content-based trigger during an image sticking measurement. The image-content-based trigger method for image sticking is covered by TechnoTeam's international patent family — see US 11,557,111 B2.
Grey-level dependency and uniformity correction
In image sticking measurements, it is key to separate static display non-uniformity from non-uniformity caused by image sticking. There are two different ways to do this separation: The temporal and the local approach. Furthermore, static non-uniformity and the induced image sticking can strongly depend on the grey level, as the measurement example below shows.
TechnoTeam's software solutions offer total flexibility regarding the applied grey levels and the type of non-uniformity corrections with all their advantages and disadvantages — even in post-processing. That way, we can ensure that the image sticking measurement can be tailored to the specific project.
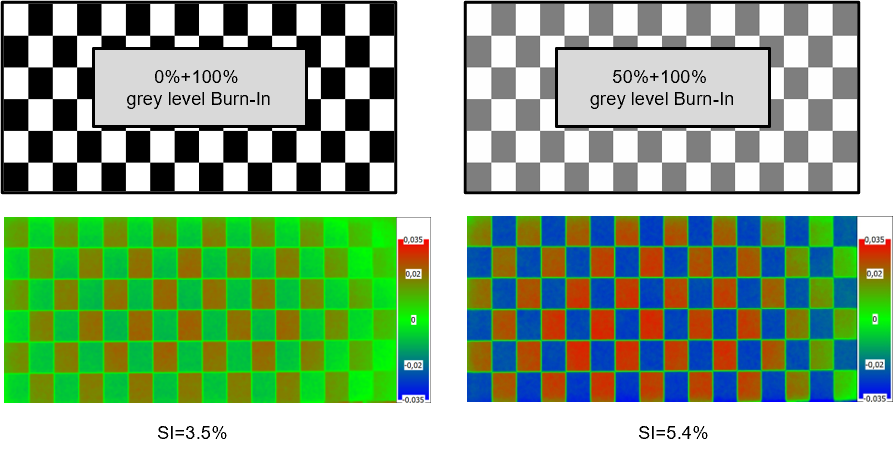
Example for the impact of the grey levels: For this liquid crystal test display, different burn-in and relaxation grey levels lead to significantly different image sticking results
Results
The image sticking results are given as time-resolved measurement values in percentages including all raw data. Also, all raw images can be saved during an image sticking measurement series. This also allows post-processing data, e.g., the change of the non-uniformity correction between the local and temporal approach. The 3-Level approach from the DFF further introduces a spatial aspect, where the image sticking phenomenon is analyzed for different columns. This concept also allows a direct extension to color-image sticking measurements, which is important for, e.g., OLED displays.
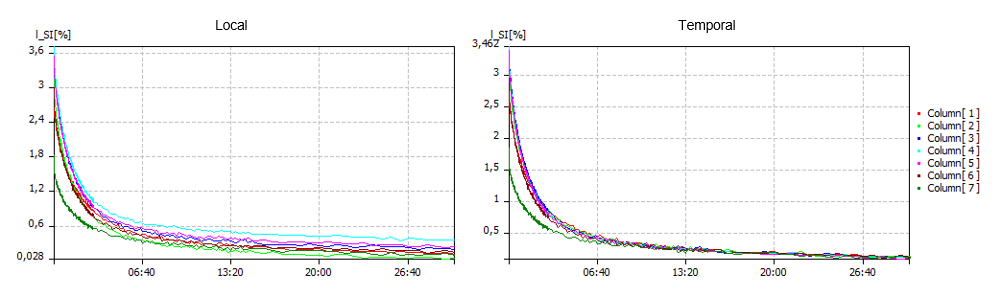
Image sticking relaxation results with two different types of non-uniformity correction: Left: Local and Right: Temporal. The type of correction can also be changed after the measurement for some methods
Summary
This Application Note introduced the temporal phenomenon of image sticking and what aspects should be considered during its measurement. Starting from the basic measurement principles, important measurement aspects were discussed briefly. Because an image sticking measurement takes so much time, the three aspects — temporal alignment, grey level dependency and non-uniformity correction — should be settled before the measurement starts, together by the measurement engineer and the person who owns the specification.
FAQ — Image Sticking measurement
What is image sticking, and how does it differ from image retention, ghosting and burn-in?
Image sticking is the effect in which the content of a previously displayed image remains partially visible after the image has changed. It is induced by static or partially static content, and how strongly it appears depends on the display technology, on the grey levels involved and on how long the static content was shown.
Reversibility is the distinction that matters. Image sticking is reversible: the residual image decays over seconds, minutes or hours until the display has returned to its original state. Burn-in is permanent. Image retention, residual image, latent image and ghosting all denote the reversible form, and the literature does not always keep the names apart.
Which form a display shows depends on its technology, though not exclusively. Liquid crystal displays typically show image sticking only, because the effect is a temporary change of the birefringence in the liquid crystal layer. OLED displays are known for burn-in, because differential ageing of the emitters is permanent. Both effects can occur on either technology, and other display technologies can show one or the other as well.
What are the three phases of an image-sticking measurement?
A measurement series consists of a warm-up phase, a burn-in phase and a relaxation phase.
The warm-up phase drives the display with constantly changing content so that it reaches a steady state and recovers from any image sticking left over from earlier use. In several procedures a reference image at the relaxation grey level is captured at the end of this phase, because that image is later used to correct the display's own non-uniformity.
The burn-in phase shows the chosen burn-in pattern for an agreed time. Conventionally this is a checkerboard of neighbouring fields at two grey levels; which grey levels actually produce the worst case depends on the panel. Automotive specifications also fix the conditions; the burn-in is carried out at an elevated panel temperature that the specification defines, typically around 65 °C.
The relaxation phase replaces the burn-in pattern with the relaxation pattern and measures the luminance distribution repeatedly while the effect decays. The values of interest are the initial level of image sticking immediately after the switch, the values after agreed delay times, and the recovery time until the display has returned to its original state.
How important is the temporal alignment of the first relaxation measurement?
The first measured value is an important result and at the same time the measurement most critical with respect to timing. If it starts before the pattern switch on the display is complete, remnants of the burn-in pattern are evaluated and the reported value is too high.
How large that error becomes was measured directly. The same display was evaluated repeatedly with no meaningful burn-in, across two computers and three video interfaces, so every reading should have been close to zero. Depending on the combination the medians ranged from 2.7 percent to 35 percent, and individual readings reached 61 percent. The high readings would be spotted as erroneous; the ones in the lower part of that range are indistinguishable from real image sticking. That is what makes this error dangerous.
Why is it not enough to simply wait long enough before the first measurement?
Waiting is the obvious answer: choose a delay that is safely longer than the worst-case input lag of the whole signal chain, which may amount to several hundred milliseconds. It removes the risk of measuring too early, and where the relaxation is slow it costs nothing.
Where the relaxation is fast it costs precision. For an exponential relaxation with a time constant of eight seconds, a measurement that starts at 0.5 seconds instead of 0.1 seconds reads about five percent low, and one that starts at one second about ten percent low. The relaxation behaviour of an unknown display cannot be assumed in advance, so the size of that error is not known either.
The lag itself also stays unknown, and therefore stays part of the overall uncertainty. The same delay on two systems with different lags starts the measurement at two different points of the relaxation, so results from different setups are hard to compare.
Whether a chosen delay is long enough can be checked: run the series with a burn-in time of zero and repeat it a few times. Every reading should then lie close to zero. Readings above that level show that the measurement still starts too early.
How is the timing realised with high precision?
There are three ways, and they differ in what they require.
If the input lag of the setup is known exactly, the measurement can be timed against it. This presupposes that the lag is known for the specific combination of computer, video interface and display, and that it stays constant.
An external optical trigger removes that requirement. A photosensitive element is connected to the camera's external trigger input, watches the display and triggers the acquisition as soon as it detects the pattern switch. That establishes a well-defined reference point.
A trigger inside the measurement device does the same without additional hardware in front of the display. TechnoTeam developed such an image-content-based trigger for the LMK 6: the camera observes a freely adjustable part of the burn-in pattern at very high frequency, detects the switch optically, and starts the measurement after a freely chosen delay from that reference point.
What is the difference between temporal and local non-uniformity correction?
Every image sticking evaluation has to distinguish the image sticking effect from the display's own spatial non-uniformity. Two options are available.
A temporal correction compares the same region of the display before and after burn-in. It corrects the non-uniformity very well, because the reference is the region itself, but it is sensitive to anything that changes between the two captures, such as a temperature drift or other changes in the ambient conditions or in the state of the panel. It also needs the warm-up phase, because the reference image is captured at its end.
A local correction compares a burn-in region with neighbouring regions that were not burnt in. Because everything it compares sits in the same image, captured at the same instant, it is relatively insensitive to changes over time: a temperature drift or a drifting panel state cannot separate the measurement from its reference. Locally confined disturbances still act, a light beam falling on part of the image for instance. The warm-up phase becomes largely unnecessary, which shortens the series. In exchange, the correction is slightly weaker, because neighbouring regions are not perfectly identical, and a residual non-uniformity always remains in the result.
The two-level approach uses a temporal reference, the three-level approach a local one. On the three-level approach both corrections can be evaluated on the same series and compared directly, provided a reference image at the relaxation grey level is available.
How much does the choice of correction actually change the result?
The influence depends on where the value is read on the relaxation curve. For the initial level it is small. For the vanishing time it can be large, depending on how non-uniform the display is.
On one automotive LCD, evaluated with all three variants on the same series, the two correction methods within the three-level approach differed by roughly a quarter of a percent. That offset is the contribution of the local correction alone. Against an initial value of several percent it hardly counts; against a late value of a few tenths of a percent it decides the result. For the two-level approach the error scales with the sticking value itself, so it vanishes as the effect vanishes.
A quick test for a given display is to run the series without the burn-in phase. Every value should then read zero, and what is left is the offset the correction leaves behind.
Why do the grey levels matter so much?
Both the induced effect and its visibility depend on the grey level, and the combination that most procedures use as a default does not produce the worst result on every panel. A burn-in with black and white fields evaluated on a mid-grey relaxation image is convenient and easy to specify, but on a given panel a different pair can be considerably more critical. On one LCD test display the worst combination was a burn-in at grey levels 128 and 255 evaluated at a relaxation grey level of 107, and it produced a relative image sticking almost twice as high as the default pair.
The consequence is that a measurement run at the default grey levels can systematically understate what the display will meet in the field. Which combination is critical cannot be predicted from the panel data, so it has to be measured.
How do I find the worst-case grey level combination?
One option is a pre-test with wedge patterns. A horizontal grey wedge serves as the burn-in pattern and a vertical grey wedge as the relaxation pattern, so that a single measurement covers all combinations of burn-in and relaxation grey level at once. The result is an image sticking grey level combination matrix, and its gradual gradients give a good idea of where the critical region lies. The spatial resolution of an imaging device is what makes this possible in one capture. The pre-test has also been adapted by the German Flat Panel Display Forum.
It stays a pre-test for three reasons. Very dark parts of the relaxation wedge no longer allow a meaningful integration time. The smooth gradients make plausibility checks harder. And, most importantly, a spatial dependency of the effect across the panel can mix with the grey-level dependency the wedge is meant to isolate, because the two vary along the same axes. The matrix therefore points at the operating point, and a regular two-level or three-level measurement at that operating point delivers the value.
Do I need an imaging luminance measurement device, or is a spot photometer enough?
Image sticking at a single location can be measured with a spot photometer. Several spot meters side by side extend that to a few more locations.
Everything beyond that is far more efficient with an imaging device. A spatially resolved evaluation, the grey level pre-test and colour effects all require many locations to be observed at the same moment of the relaxation. A sequence of single measurements runs into the temporal synchronisation problem, because the effect decays while the meter is moved. An array of spot meters avoids that timing problem but not the resolution limit: the grey level pre-test reads a whole matrix of grey level combinations from one capture, which an array cannot deliver, and its spatial resolution stays far below that of an imaging device. The imaging setup is also simpler to build in general, and especially so for curved displays.
What does an image-sticking measurement produce as a result?
The primary result is a time-resolved image sticking value in percent for each evaluation field of the burn-in pattern. What is reported for the display is usually the maximum across those fields, and from the time series, whose timestamps come directly from the image headers, follow the initial level of image sticking and the recovery time. The three-level approach reports one value per column of the pattern, which adds a spatial view of the effect, and the same approach can be extended to colour image sticking.
Storing the complete raw images is optional and not needed for the result; leaving them out saves a little time and storage on long series. Even without them part of the evaluation can still be changed afterwards, on the three-level approach for instance the type of non-uniformity correction. Changing the evaluation regions does require the full set of raw images.
Download
References
| [1] | ICDM, "RESIDUAL IMAGE (10.4), in IDMS: Information Display Measurements Standard, (2012) |
| [2] | K.-H. Blankenbach et al., "Recent Standardization Efforts and Measurement Procedures of German Automotive OEM and German Flat Panel Forum (DFF)," SID Digest, pp. 361-364, 2016. |
| [3] | H.-U. Lauer, C. Beutel, J. Faber, G. Kammerer, "Extended analysis of Sticking Image by using a 3-level burn-in pattern", in SID-ME Chapter Fall Meeting, (2010). |
| [4] | H.-U. Lauer, C. Beutel, J. Faber, "extended analysis of sticking image by using a 3-level burn-in pattern", in electronic displays conference (2013). |
| [5] | J. Bauer, K. Blankenbach, "Proposal for a Standard Measurement Procedure and Objective Characterization of Imagesticking in TFT-LCDs in Reference to Display Quality and Customers Value Perception" SID-ME Chapter Fall Meeting (2010) |
| [6] | J. Kim, K. Choi, S. Jung, J. Langehennig, D. Lee, B. Min, "An Evaluation Methodology for Display Retention Measurement", in SID 2018 DIGEST, (2018). |
| [7] |
I. Rotscholl, U. Krüger, "Aspects of Image Sticking Evaluations Using Imaging Luminance Measurement Devices", in SID DIGEST 2019. |
| [8] | H.-U. Lauer et al., "Accurate measurement and inspection of sticking image in TFT LCDs," in SID Mid-Europe Chapter Fall Meeting, 2010 |
| [9] | I. Rotscholl, U. Krüger, "Non-uniformity correction in recent automotive image sticking evaluation methods" in SID Vehicle conference 2019. |
| [10] | D.-G. Lee, I.-H. Kim, H-S. Soh, B. C. Ann "Measurement and Analysis Method of Image Sticking in LCD", in SID 02 DIGEST, (2002). |
| [11] | I. Rotscholl, U. Krüger, "Requirements on the characterization of optical display attributes for automotive applications" in SID Vehicle conference 2018. |
| [12] | G. Steinaecker et al., "Image Sticking von LCDs," http://www.burosch.de/images/docs/ed_2005_image_sticking_LCD_final.pdf, 2018. |
| [13] | H.-J. Park et al., "Analysis of IPS Mura, Image Sticking and Flicker caused by Internal DC Effects,," in SID Digest, 2003. |
| [14] | K. Tsutsui et al., "An Image Sticking Free Novel Alignment Material for IPS-LCD," in SID Digest, 2003. |
| [15] | F. Wölzl, Degradation Mechanisms in Small Molecule Organic Electronic Devices, 2016. |
| [16] | K. Kam, T. Yu, K. Behrman, C. Yu, I. Kymissis, "Characterizing Image Retention for HDR OLED Displays" in SID DIGEST 2020 |