Display with AGL (anti-glare layer)
Reproducible quantification of display sparkle
Application Note – Reproducible quantification of display sparkle
This page shows a summary of the application note. The topic of the document is the measurement of anti-glare layer-caused display sparkle in a reproducible manner for automotive applications.
What is display sparkle and how is it caused?
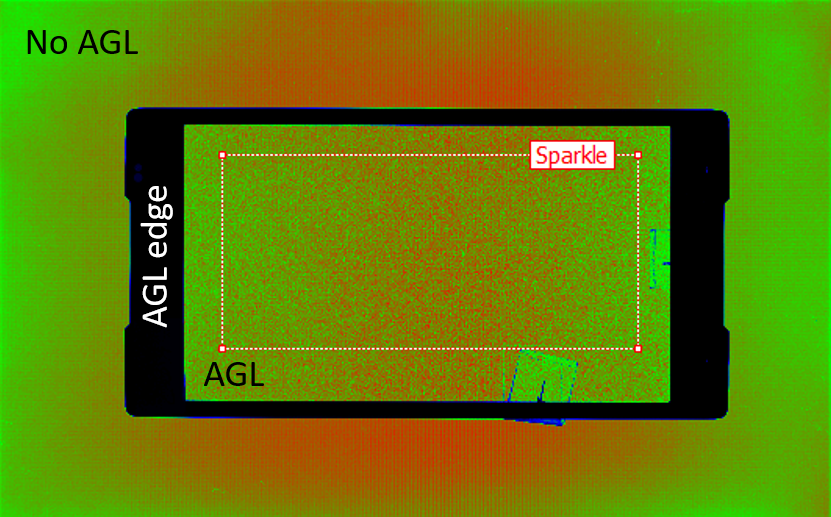
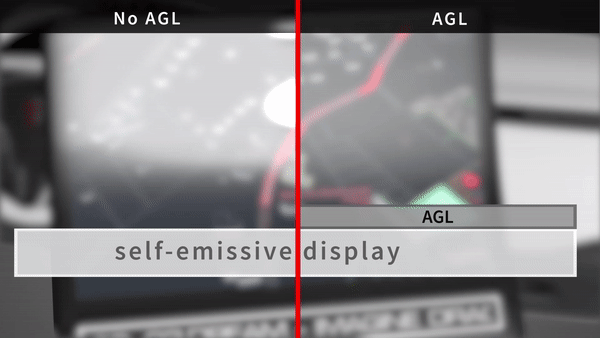
Displays used in outdoor applications, for example, automotive displays, are often equipped with anti-glare layers (AGL), which scatter a large part of incoming light (e.g., sunlight) to enhance contrast. However, they also affect the transmitted part of the light, resulting in a high-frequency water-droplet-like luminance and chromaticity non-uniformity. This phenomenon is called sparkle.
Users, system integrators and display manufacturers are interested in characterizing displays, including the level of perceived sparkle. To this end, TechnoTeam has developed a measurement solution using our LMK camera systems such that the measurements:
- show a high correlation with the sparkle perceived by humans
- are absolute and reproducible for many different LMK camera systems
- enable flexible setups, including BlackMURA-compliant setups
- can be performed without removing the AGL
Visualization of how sparkle is caused
Measurement of display sparkle
To measure display sparkle, you must first align the camera relative to the display, then set the correct focus, and finally perform the actual measurements.
The alignment is done using the established BlackMURA pattern for the geometrical setup. This way, the same setup can be used for sparkle and BlackMURA measurements.
A particularly critical aspect of the measurement setup is finding the correct focus, as undefined blurring of the sparkle pattern negatively impacts reproducibility. To alleviate this problem with both manual and autofocus lenses, we developed the distance focus scan, which changes the distance to the display and, thus, the relative focus position.
The actual measurement is based on a frequency filter approach that analyzes the captured image and suppresses only the main frequency from the periodic pixel pattern. This makes it possible to quantify the sparkle as a percentage by calculating the sparkle contrast, defined as the standard deviation of the luminance divided by the mean of the luminance.


Distance focus scan
Reproducibility
This method for measuring sparkle is reproducible and can be used with many different camera-lens combinations from TechnoTeam.
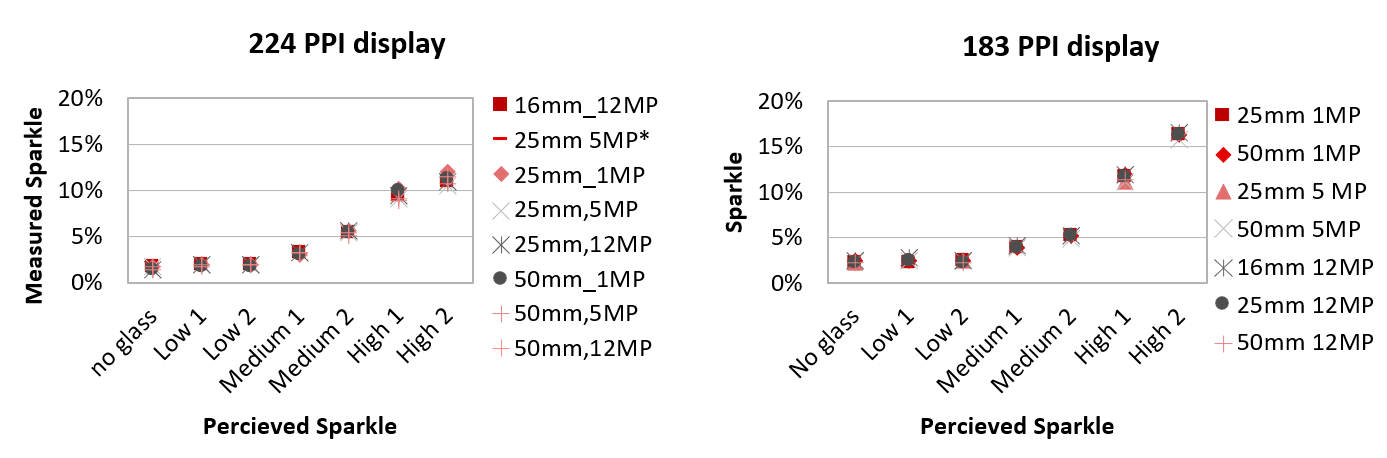
Measured sparkle results.
The x-axis of the graph shows the perceived sparkle by humans, which was rated by OEM and Tier 1 experts from the automotive industry.
The y-axis shows the measured sparkle in the specific camera lens setup.
Results
The results are given in percent. The reproducibility of this method makes it possible to use an agreed-upon threshold value for the sparkle. As there is no need to remove the AGL for the measurement, this method can be used at various stages of the development, production and implementation of displays.
Summary
This application note showed how to measure display sparkle, a high-frequency water-droplet-like luminance and chromaticity non-uniformity caused by using anti-glare layers. This technique is highly reproducible, correlates well with sparkle perceived by humans, can be used in a BlackMURA-compliant setup and can be performed without removing the AGL.
FAQ — Display sparkle measurement
What is display sparkle?
Display sparkle is a high-frequency, random luminance and chromaticity variation that appears on top of the regular pixel pattern of a display. It is associated with displays that carry an anti-glare layer (AGL) — a common cover-material option for displays used in bright environments. AGLs are widely used in the automotive sector and in other applications where ambient-light readability matters, but not every automotive or outdoor display uses one.
Where an AGL is present, it is the physical cause of the effect. The metric used to quantify it is the sparkle contrast defined in IEC 62977-3-9.
What causes display sparkle?
The anti-glare layer scatters light. That is its purpose in reflection: incoming ambient light is scattered away from the viewer so that mirror-like reflections on the display surface are suppressed and contrast in bright environments improves.
The same scattering also affects the light that the display emits through the AGL. The microstructure of the layer refracts and scatters the light from individual subpixels in slightly different directions. What arrives at the viewer is a random, high-frequency luminance variation on top of the regular pixel grid. That variation is what we measure as sparkle. Sparkle strength depends on the AGL design (foil vs. glass, roughness, layer thickness, distance to pixel layer) and on the display behind it (subpixel layout, PPI).
Why is reproducible sparkle measurement difficult?
Sparkle measurements are sensitive to several setup conditions: where the focus is set, how finely the camera samples the display, what aperture the lens uses, and which algorithm is used to separate the sparkle signal from the regular pixel pattern. If these conditions are not controlled, two labs measuring the same panel can read very different values.
IEC 62977-3-9 acknowledges this in two ways. It requires every measurement to document the relevant setup conditions, and it permits several different image-processing and capturing methods to separate the sparkle signal from the pixel matrix. The TechnoTeam procedure addresses each of these conditions in turn: a distance focus scan handles the focus position, Fourier downsampling handles the sampling resolution, an in-house aperture window keeps the angular aperture in a reproducible range, and the chosen separation algorithm is a frequency filter that stays compatible with BlackMURA setups.
What is sparkle contrast?
Sparkle contrast is the metric used to quantify display sparkle. It is expressed in percent and defined as the standard deviation of the luminance divided by the mean of the luminance. For the frequency-filter method, it is calculated on the frequency-filtered image rather than on the raw capture and within a defined region of interest.
How does the frequency-filter method work, and why was it chosen?
A captured luminance image of the display is transformed into the frequency domain. There, two contributions are filtered out: the periodic component from the pixel grid and the low-frequency component from large-scale luminance variations such as backlight gradients. The image is then back-transformed to the spatial domain, and the sparkle contrast is evaluated on the filtered image. What remains is the high-frequency signal that corresponds to the perceived sparkle.
The frequency-filter approach is one of several separation methods that IEC 62977-3-9 permits. TechnoTeam selected it because it works under similar sampling and alignment conditions as BlackMURA, so a single measurement cell can run both measurements. To make the result comparable across different cameras and lenses, the inverse Fourier transform additionally suppresses frequencies above a common reference — a step that removes the dependence on the actual sampling resolution within the validated measurement window.
How is sparkle separated from the random sensor noise of the ILMD?
The random sensor noise of an imaging luminance measurement device (ILMD) looks similar to sparkle in the captured image: both are high-frequency and random. Once the periodic pixel grid has been filtered out, sensor noise can therefore contribute to the measured sparkle contrast and would falsely increase the reported value. The effect is small for displays with strong sparkle, where the sparkle signal dominates, but it can become significant at low sparkle levels — close to the level of a panel without any AGL.
The countermeasure is averaging. Several ILMD captures of the same image are taken and combined before the sparkle contrast is calculated. The sparkle signal stays constant under this averaging, while the random noise component drops by a factor of √N for N captures, so a small number of captures already reduces the noise contribution to a level well below the sparkle signal.
How well does the measurement correlate with human perception?
The method was validated against subjective expert ratings during its development. Automotive-display quality engineers rated a set of AGL samples on a low, medium and high scale without knowing the measured values, and the sparkle contrast values then followed the visual ranking with a clear monotonic relationship across the three categories. The procedure has since been verified in a round-robin experiment across three independent laboratories.
The acceptance threshold for a "good" sparkle value is set by the OEM or by the application. Also IEC 62977-3-9 does not define one.
Does the anti-glare layer need to be removed for the measurement?
No. Our procedure was designed so that the AGL stays on the display, which is what makes the measurement usable across the full lifecycle: AGL development, supplier qualification and incoming inspection on the assembled module. The same procedure applies to coated cover glass on a reference display and to a finished module, and both glass-based and foil-based AGLs are covered.
Download
References
| [1] | Becker M. E., Sparkle measurement revisited: A closer look at the details, J. Soc. Inf. Disp. 23 (10), (2015) |
| [2] | Becker M. E., 8-1: Standardization of Sparkle Measurement: A Solid Basis, SID Symposium Digest of Technical Papers, 49, 1, (2018). |
| [3] | Rotscholl I., Rasmussen J., Rickers C. et al., Understanding and Achieving Reproducibility for the Evaluation of Display Sparkle Contrast, Proc. International Conference on Display Technology 2020, (2020) |
| [4] | Rotscholl I., Rasmussen J., Rickers C. et al., Understanding and Achieving Reproducible Sparkle Measurements for an automotive specification, Proc. SID Vehicle Display 2020, (2020) |
| [5] | Kurashige M. et. al, VHF1-3 Estimation of Equivalent Conditions for Display Sparkle Measurement, Proc. International Display Workshop (2019) |
| [6] | Isshiki M., Inouye A., Tamada M., Kobayashi Y., 78‐3: The Optimized Condition for Display Sparkle Contrast Measurement of Anti‐Glare Cover Glass based on the Solid Understandings, SID Symposium Digest of Technical Papers, 50, 1, (2019) |
| [7] |
German Automotive OEM Work Group Displays, Uniformity Measurement Standard for Displays V1.3, (2018) |